
This post introduces the paper Analytical solution for one-dimensional chemo-hydro-mechanical coupled consolidation under time-dependent loading in buffer clay layer, published in the Canadian Geotechnical Journal (2025, 62: 1–13). Addressing the situation in landfills and similar works where the load is applied progressively over time, the study establishes a one-dimensional chemo-hydro-mechanical (CHM) coupled consolidation model for a buffer clay layer. The two coupled partial differential equations are decoupled by a linear combination, and analytical solutions are derived for four cases: ramp loading and exponential loading, each under single-sided and double-sided drainage. After verification against numerical solutions obtained with COMSOL Multiphysics, the influence of eight parameters on pore water pressure and contaminant transport is analysed systematically.
Paper Information
| Item | Content |
|---|---|
| Title | Analytical solution for one-dimensional chemo-hydro-mechanical coupled consolidation under time-dependent loading in buffer clay layer |
| Authors | Xibin Li, Yanghai Shen, Xiangyang Yu, Zhiqing Zhang, Wenjie Zhang |
| Journal | Canadian Geotechnical Journal, 2025, 62: 1–13 |
| DOI | 10.1139/cgj-2024-0145 |
| Timeline | Submitted 2024-03-17; accepted 2024-09-19; accepted manuscript online 2024-09-24; version of record online 2025-01-24 |
| Author’s contribution | Third author; according to the CRediT statement of the paper, responsible for Formal analysis, Software and Validation |
1. Background
Buffer clay layers are widely used as barrier layers in landfills, industrially contaminated sites and radioactive waste repositories. Three classes of mutually coupled processes take place simultaneously in a buffer layer:
- Chemical process: concentration gradients drive contaminant diffusion, which determines the breakthrough time of contaminants through the buffer layer;
- Hydro-mechanical process: external loading compresses the soil skeleton, generating excess pore water pressure and driving pore fluid seepage, which in turn carries contaminants by advection;
- Chemo-mechanical feedback: changes in pore fluid concentration cause volume change of the soil (chemo-osmotic consolidation), and the concentration gradient itself also drives pore water flow (chemo-osmotic effect).
Existing studies have two limitations. First, many contaminant transport models treat the soil as an incompressible medium and neglect the two-way coupling between consolidation and transport. Second, existing analytical solutions for CHM coupled consolidation (e.g. Zheng et al. 2021, 2023) assume a constant mechanical load. In actual landfills, waste is placed in stages, so the load acting on the buffer layer increases gradually with time; studies on one-dimensional consolidation theory have also shown that the loading process is a key factor governing the development of consolidation. The paper therefore establishes an analytical solution for CHM coupled consolidation under time-dependent loading.
2. Mathematical Model
2.1 Problem Description and Basic Assumptions
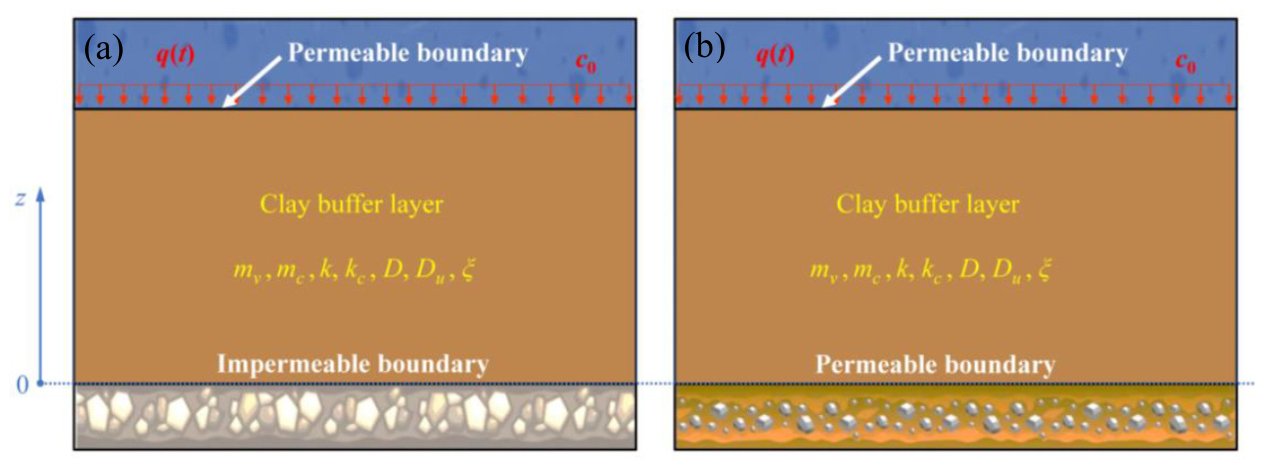
As shown in Figure 1, the top surface of the buffer clay layer is subjected to a mechanical load $q(t)$ and is in contact with a chemical solution of concentration $c_0$; the bottom surface is either impermeable (Case A, single-sided drainage) or permeable (Case B, double-sided drainage). The basic assumptions are: the soil layer is fully saturated, and the coefficient of volume compressibility and the hydraulic conductivity remain constant during consolidation; soil particles and pore water are incompressible; deformation is small, and seepage and solute transport occur only in the vertical direction.
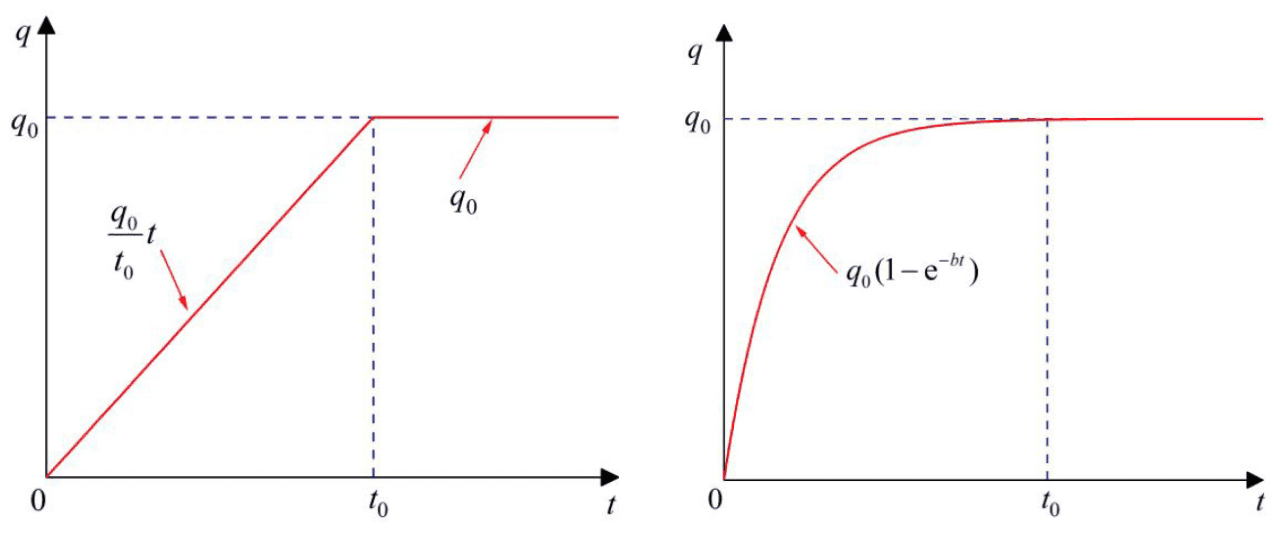
Two typical forms of time-dependent loading are considered (Figure 2):
- Ramp loading: $q(t) = q_0 t / t_0$ for $t \le t_0$, and $q(t) = q_0$ for $t > t_0$;
- Exponential loading: $q(t) = q_0 \left[1 - \exp(-bt)\right]$.
2.2 Constitutive Relations and Conservation Equations
The change in porosity is the superposition of two parts, one due to the effective stress increment and the other due to the concentration change, where $m_v$ is the coefficient of volume compressibility under mechanical loading and $m_c$ is the coefficient of volume change due to concentration change:
$$ \Delta n = -m_v \left[q(t) - u\right] - m_c (c - c_0) $$
The pore water velocity is controlled by both the pore pressure gradient and the concentration gradient (chemo-osmotic effect), and the solute flux comprises a diffusion term and an ultrafiltration term:
$$ v = -\frac{k}{\gamma_w}\frac{\partial u}{\partial z} + k_c \frac{\partial c}{\partial z}, \qquad J = -D \frac{\partial c}{\partial z} + D_u \frac{\partial u}{\partial z} $$
where $k$ is the hydraulic conductivity, $k_c$ is the chemo-osmotic conductivity, $D$ is the effective diffusion coefficient and $D_u$ is the ultrafiltration coefficient. In addition, the amount of adsorbed water varies with concentration, which changes the pore fluid density; the parameter $\xi$ denotes the relative change in total pore fluid density per unit concentration increment. Substituting the above relations into the mass conservation equations of the fluid phase and the solute yields, after rearrangement, the coupled equations in terms of the excess pore water pressure $u$ and the concentration $c$:
$$ \frac{\partial u}{\partial t} = W_w \frac{\partial^2 u}{\partial z^2} + W_c \frac{\partial^2 c}{\partial z^2} + \frac{\mathrm{d} q}{\mathrm{d} t} $$
$$ \frac{\partial c}{\partial t} = C_w \frac{\partial^2 u}{\partial z^2} + C_c \frac{\partial^2 c}{\partial z^2} $$
The coefficients $W_w$, $W_c$, $C_w$ and $C_c$ are combinations of material parameters such as $k$, $k_c$, $m_v$, $m_c$, $D$, $D_u$, $\xi$, $n_0$ and $c_0$. $W_c$ and $C_w$ are cross-coupling terms: $W_c$ reflects the effect of the concentration field on pore pressure, and $C_w$ reflects the effect of the pore pressure field on concentration.
2.3 Boundary Conditions
Top surface: $u(L,t) = 0$, $c(L,t) = c_0$. Bottom surface: zero-gradient conditions for Case A ($\partial u/\partial z = 0$, $\partial c/\partial z = 0$); zero-value conditions for Case B ($u = 0$, $c = 0$).
3. Decoupling Method and Analytical Solution
The diffusion terms of the above system are coupled in matrix form. The paper introduces the linear combination $\varphi = p_1 u + p_2 c$ and requires the combination coefficients to satisfy
$$ (W_w - Q) p_1 + C_w p_2 = 0, \qquad W_c p_1 + (C_c - Q) p_2 = 0 $$
that is, $(p_1, p_2)$ is a left eigenvector of the diffusion coefficient matrix $\mathbf{A}$ (first row $W_w$, $W_c$; second row $C_w$, $C_c$), and $Q$ is the corresponding eigenvalue. The condition for a non-trivial solution gives two eigenvalues:
$$ Q_{1,2} = \frac{1}{2}\left[ C_c + W_w \pm \sqrt{(C_c - W_w)^2 + 4 C_w W_c} \right] $$
This yields two mutually independent inhomogeneous diffusion equations ($i = 1, 2$):
$$ \frac{\partial \varphi_i}{\partial t} - Q_i \frac{\partial^2 \varphi_i}{\partial z^2} = \beta_i \frac{\mathrm{d} q}{\mathrm{d} t} $$
where $\varphi_1 = u + p_{21} c$, $\varphi_2 = p_{12} u + c$, $\beta_1 = 1$ and $\beta_2 = p_{12}$. The decoupled equations are solved by separation of variables together with the Laplace transform and its inverse, giving series solutions for ramp loading and exponential loading under Case A and Case B. The eigenvalues are $\lambda_N = (N + 1/2)\pi / L$ ($N = 0, 1, 2, \ldots$) for Case A and $\lambda_N = N\pi / L$ ($N = 1, 2, \ldots$) for Case B. Finally, back-substitution through
$$ u = \frac{p_{21}\varphi_2 - \varphi_1}{p_{12}p_{21} - 1}, \qquad c = \frac{p_{12}\varphi_1 - \varphi_2}{p_{12}p_{21} - 1} $$
gives the analytical expressions for pore pressure and concentration. The essential point of the method is that, provided the two eigenvalues of $\mathbf{A}$ are distinct positive real numbers, the cross-coupled system can be transformed by eigendecomposition into two standard diffusion problems, so that the solution techniques of classical consolidation theory remain applicable.
4. Verification of the Analytical Solution
The original coupled system is solved directly with the mathematics interface of COMSOL Multiphysics and compared with the analytical solution. In the example, the soil layer thickness is 1 m, the series is truncated at $N = 100$ terms, and the baseline parameters are listed in the table below (Table 1 in the original paper).
| Parameter | Value | Meaning |
|---|---|---|
| $n_0$ | 0.5 | Initial porosity |
| $c_0$ | 230 kg/m³ | Solution concentration at the top surface |
| $q_0$ | 1×10⁵ Pa | Final value of the time-dependent load |
| $m_v$ | 5×10⁻⁷ 1/Pa | Coefficient of volume compressibility under mechanical loading |
| $m_c$ | 1.05×10⁻⁴ m³/kg | Coefficient of volume change due to concentration change |
| $k$ | 1×10⁻¹⁰ m/s | Hydraulic conductivity |
| $k_c$ | 2.14×10⁻¹³ m⁵/(kg·s) | Chemo-osmotic conductivity |
| $\gamma_w$ | 10 000 N/m³ | Unit weight of water |
| $\xi$ | 0 m³/kg | Coefficient of pore fluid density change with concentration |
| $D$ | 2.5×10⁻¹⁰ m²/s | Effective diffusion coefficient |
| $D_u$ | 0 s | Ultrafiltration coefficient |
| $t_0$ | 30 d | Loading duration of the ramp load |
Figures 3 and 4 show the pore pressure distributions at different times under single-sided and double-sided drainage, respectively; the analytical solutions agree with the finite element results.
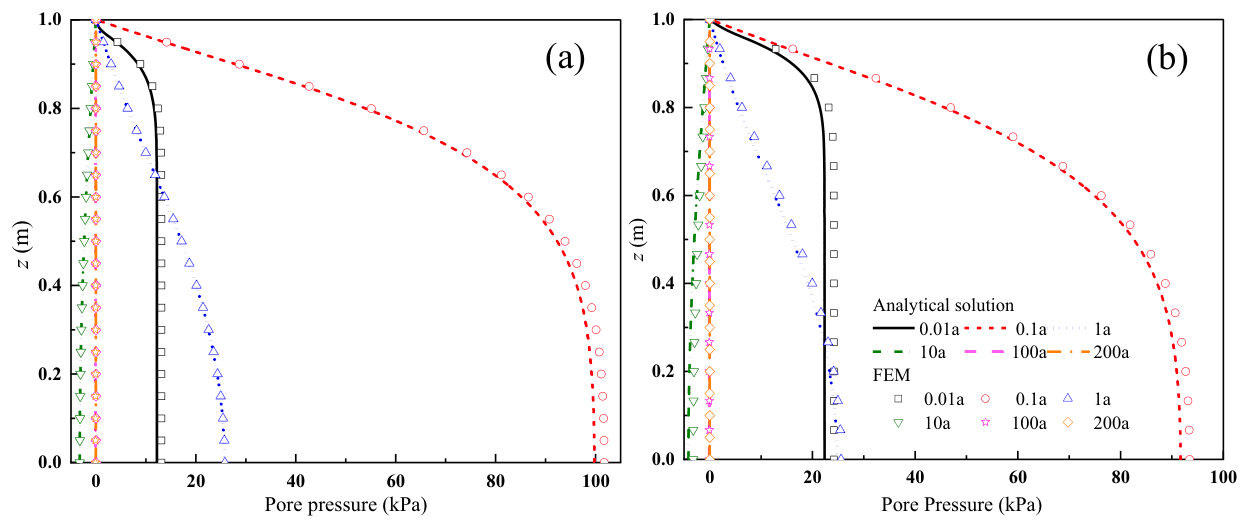
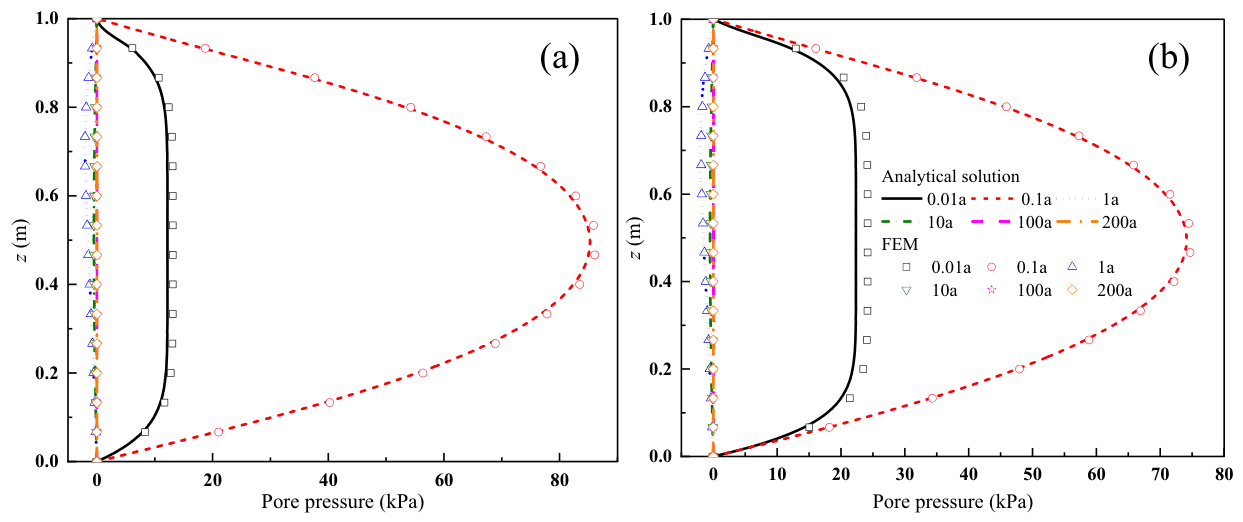
Figures 3 and 4 reveal the following trends:
- The time scales of the two processes differ by a factor of about 20: the pore pressure induced by mechanical loading dissipates within about 10 years, whereas solute diffusion requires about 200 years to reach a steady state.
- Origin of negative pore pressure: in Case A, a distinct negative excess pore water pressure appears at $t = 10$ years, and the pore pressure essentially vanishes after $t > 100$ years. The early-stage pore pressure is dominated by mechanical loading; after the load-induced pore pressure has dissipated, the concentration gradient drives pore water from regions of low concentration toward regions of high concentration, which, under the solution boundary condition at the top surface, manifests as outward seepage and thus produces negative pore pressure.
- Effect of boundary conditions: at $t = 10$ years, the excess pore water pressure in Case B has fully dissipated, whereas a considerable negative pore pressure remains in Case A. The pore pressure distribution in Case B is no longer symmetric about the mid-plane of the layer as in the Terzaghi solution; because the solute diffuses from the top downward, the negative pore pressure in the upper part of the layer exceeds that in the lower part.
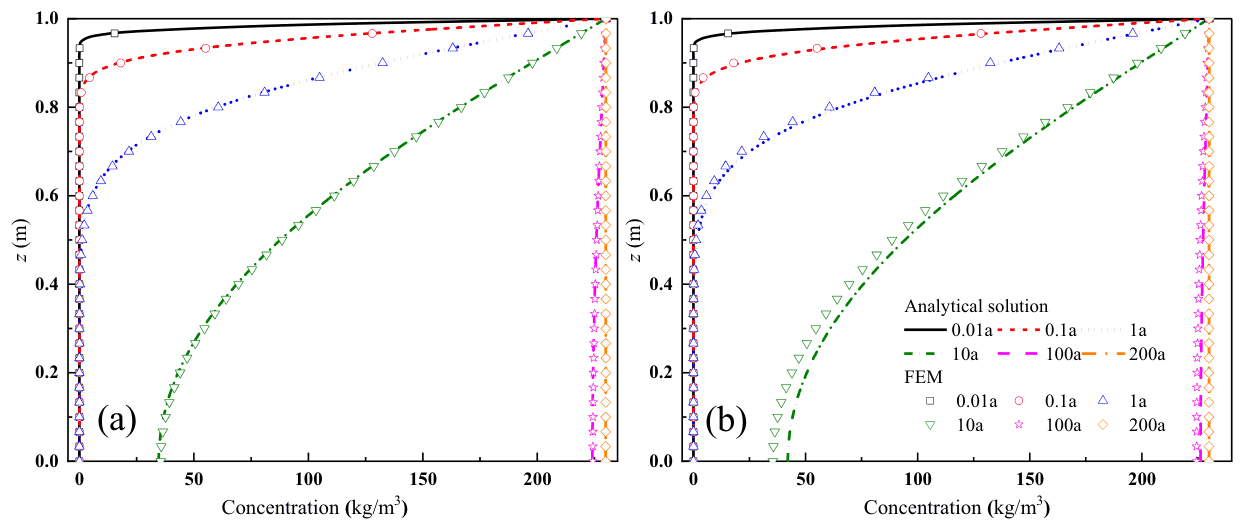
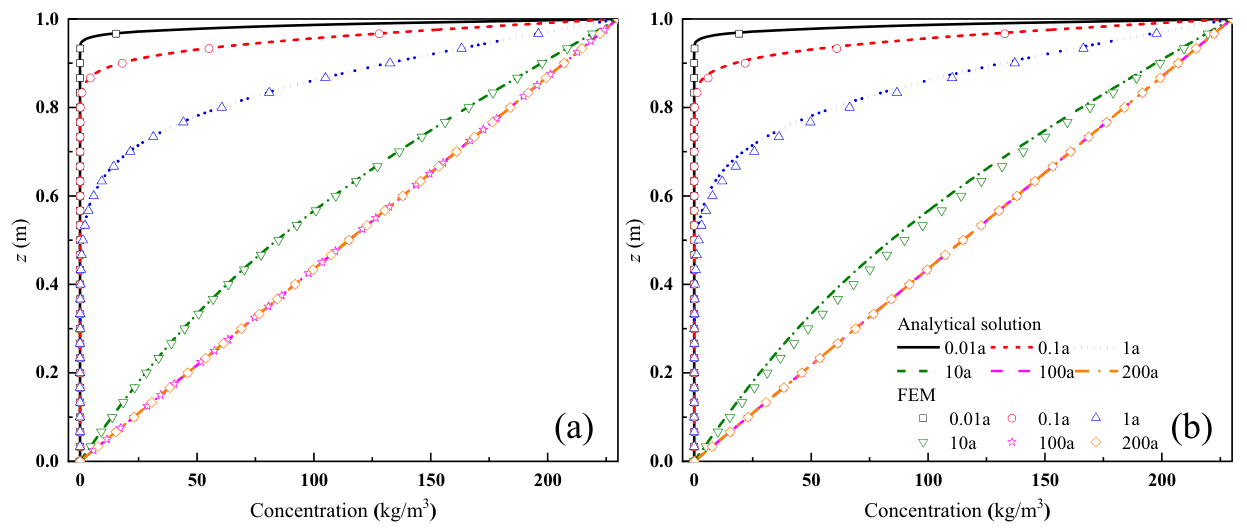
Figures 5 and 6 show that solute transport is faster under double-sided drainage than under single-sided drainage. At $t = 200$ years, the concentration in Case A tends to be uniform with depth (close to $c_0$), whereas Case B exhibits a linear distribution from 0 at the bottom to $c_0$ at the top, consistent with the steady-state solutions under the two bottom boundary conditions.
5. Parametric Sensitivity Analysis
Taking ramp loading with single-sided drainage (Case A) as the reference case and $t = 1$ year as the observation time, the parameters are varied one at a time to examine their influence. Representative results are shown in Figures 7–10.
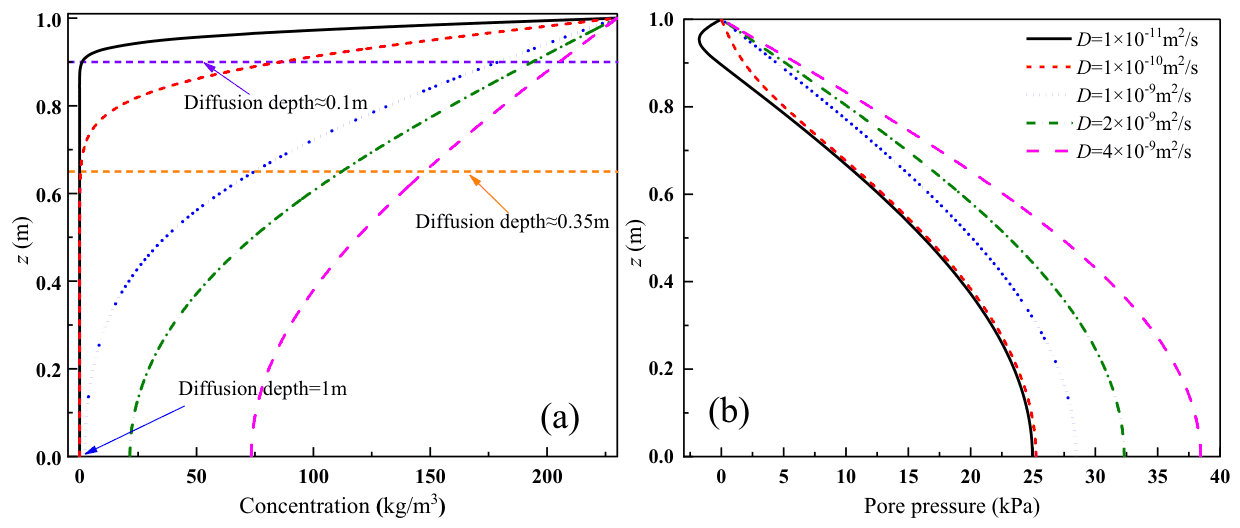
When $D$ increases from $1\times10^{-11}$ to $1\times10^{-10}$ and $1\times10^{-9}$ m²/s, the solute diffusion depth at $t = 1$ year is approximately 0.1, 0.35 and 1 m, respectively. A larger $D$ results in slower pore pressure dissipation: the pore pressure at the bottom is about 25 kPa for $D = 1\times10^{-11}$ m²/s and increases to about 38 kPa for $D = 4\times10^{-9}$ m²/s. When $D$ is small, the concentration gradient is large, and chemo-osmotic consolidation produces negative pore pressure near the top of the layer.
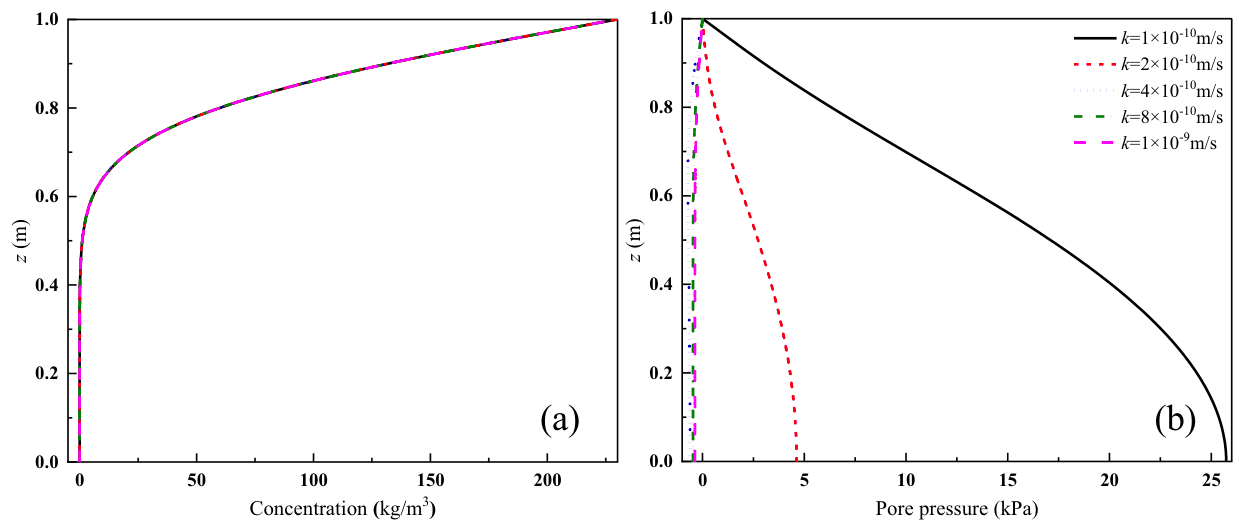
$k$ has almost no influence on solute transport but a significant influence on pore pressure dissipation. For $k = 1\times10^{-10}$ m/s, the pore pressure at the bottom is about 25 kPa; for $k > 4\times10^{-10}$ m/s, the pore pressure due to mechanical loading has essentially dissipated within 1 year, and the negative pore pressure induced by the concentration gradient becomes observable. The reason $k$ does not affect solute transport is that, under small deformation, the advective distance caused by consolidation is limited and advection ceases once consolidation is complete, so its contribution to solute transport is much smaller than that of diffusion. Advection becomes the dominant factor only when a constant hydraulic head difference exists between the top and bottom surfaces of the layer, a situation outside the scope of the study.
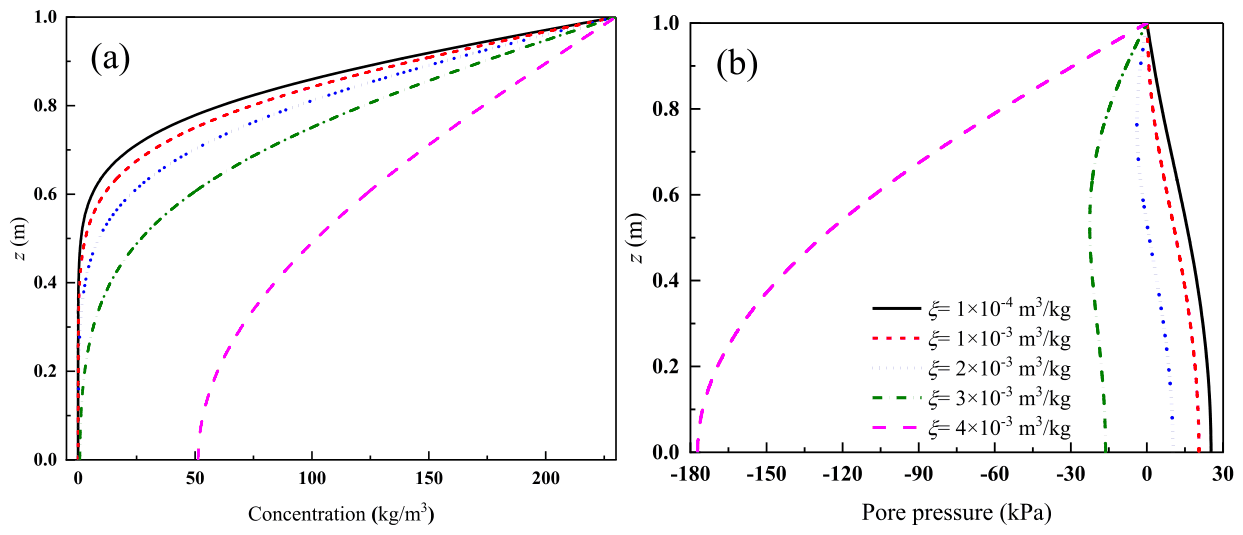
$\xi$ significantly affects both transport and pore pressure: a larger $\xi$ results in faster solute transport and a larger negative pore pressure due to concentration change. For $\xi = 4\times10^{-3}$ m³/kg, the negative pore pressure at the bottom falls below −150 kPa, a magnitude exceeding the final load value $q_0$ (100 kPa).
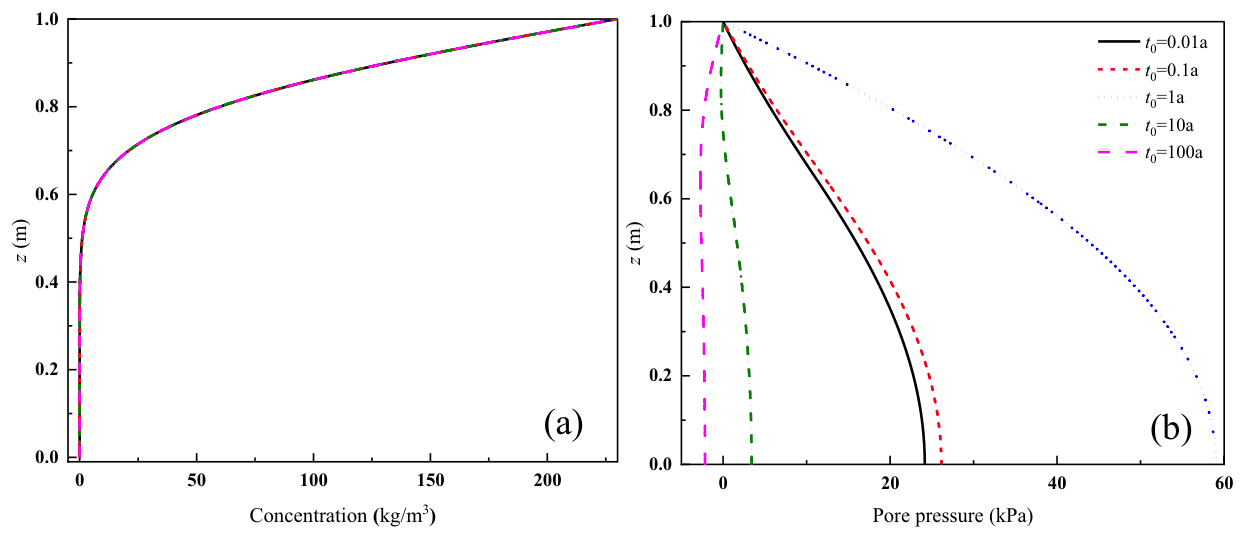
The influence of $t_0$ on solute transport is negligible, because the time required for mechanical consolidation is much shorter than the solute transport time. A larger $t_0$ corresponds to a lower loading rate and a smaller pore pressure induced by mechanical loading. For $t_0 = 100$ years, the positive pore pressure due to loading and concentration change is essentially negligible, the pore pressure becomes negative, and chemo-osmotic consolidation dominates.
The effects of all eight parameters are summarised as follows:
| Parameter | Effect on contaminant transport | Effect on pore pressure |
|---|---|---|
| $D$ (effective diffusion coefficient) | Significant | Significant: a larger $D$ slows dissipation; negative pore pressure appears at the top when $D$ is small |
| $D_u$ (ultrafiltration coefficient) | Significant (conclusion of the paper); the differences in the figures are concentrated near the drained top boundary | A larger $D_u$ slows dissipation, most evidently near the impermeable bottom boundary |
| $\xi$ (density change coefficient) | Significant: a larger $\xi$ accelerates transport | Significant: a larger $\xi$ increases negative pore pressure |
| $k$ (hydraulic conductivity) | Negligible | Significant: a larger $k$ accelerates dissipation of load-induced pore pressure |
| $k_c$ (chemo-osmotic conductivity) | Negligible | A larger $k_c$ reduces excess pore water pressure; osmosis-induced negative pore pressure offsets load-induced pore pressure and accelerates consolidation |
| $m_c$ (coefficient of volume change due to concentration) | Negligible | With a larger $m_c$, increasing concentration reduces porosity, and the positive pore pressure from osmotic consolidation increases |
| $m_v$ (coefficient of volume compressibility) | Negligible | A larger $m_v$ slows dissipation, consistent with Terzaghi consolidation theory |
| $t_0$ (loading duration) | Negligible | A larger $t_0$ reduces load-induced pore pressure and increases the share of chemo-osmotic consolidation |
6. Main Conclusions
- All parameters studied affect the generation and dissipation of pore pressure, but only $D$, $D_u$ and $\xi$ significantly affect contaminant transport; the influence of the remaining parameters is negligible.
- Hydraulic and diffusive boundary conditions significantly affect pore pressure distribution and contaminant transport: under double-sided drainage (Case B), both pore pressure dissipation and contaminant transport are faster than under single-sided drainage (Case A).
- Increases in mechanical load and in concentration produce positive pore pressure, whereas the concentration gradient produces negative pore pressure. Early-stage pore pressure is dominated by mechanical loading, and late-stage pore pressure is dominated by the negative pore pressure induced by the concentration gradient; the two differ in magnitude.
- The longer the duration of mechanical loading (i.e. the lower the loading rate), the more pronounced the negative pore pressure induced by the concentration gradient.
7. Engineering Implications
The above conclusions have two direct implications for the design of buffer clay layers. First, the contaminant breakthrough time is controlled mainly by $D$, $D_u$, $\xi$ and the bottom boundary condition, whereas permeability and compressibility parameters have a negligible effect on it. Second, the slower the filling process, the more prominent the negative pore pressure induced by chemical osmosis; evaluating the pore pressure and effective stress state of the buffer layer under a constant-load assumption will therefore introduce deviations. In addition, the analytical solution corresponds to a linear coupled diffusion system and can serve as a benchmark for numerical methods (including physics-informed neural networks, PINNs) applied to multiphysics coupling problems, which connects with the research direction of the post on this site PINN solution of Biot consolidation in saturated soil (in Chinese).
Citation
Li X, Shen Y, Yu X, Zhang Z, Zhang W. Analytical solution for one-dimensional chemo-hydro-mechanical coupled consolidation under time-dependent loading in buffer clay layer. Canadian Geotechnical Journal, 2025, 62: 1–13. https://doi.org/10.1139/cgj-2024-0145
@article{li2025analytical,
  title   = {Analytical solution for one-dimensional chemo-hydro-mechanical coupled consolidation under time-dependent loading in buffer clay layer},
  author  = {Li, Xibin and Shen, Yanghai and Yu, Xiangyang and Zhang, Zhiqing and Zhang, Wenjie},
  journal = {Canadian Geotechnical Journal},
  volume  = {62},
  pages   = {1--13},
  year    = {2025},
  doi     = {10.1139/cgj-2024-0145}
}
Note: the figures and tables in this post are reproduced from the original paper (© 2025 The Author(s), published by Canadian Science Publishing); the captions are paraphrased and are provided for academic exchange only.