
This post introduces the paper Experimental study on the interaction mechanisms of soil overlying embedded foundations under reverse faults, published in Transportation Geotechnics (2025, 54: 101596). Through 26 1g model tests combining three factors (foundation position, embedment depth and structural load), the study examines the interaction between embedded foundations and the rupture zone under reverse fault movement. Based on the characteristics of ground surface and foundation displacement, the interaction is classified into three modes: bottom contact, sidewall-bottom contact and sidewall contact. The transitions between the modes are delineated, and the underlying mechanisms are explained in terms of foundation stiffness and additional stress.
Paper Information
| Item | Content |
|---|---|
| Title | Experimental study on the interaction mechanisms of soil overlying embedded foundations under reverse faults |
| Authors | Li Guan, Daosheng Ling, Chengbao Hu, Xiangyang Yu, Kunming Song |
| Journal | Transportation Geotechnics, 2025, 54: 101596 |
| DOI | 10.1016/j.trgeo.2025.101596 |
| Timeline | Submitted 2025-01-19; revised 2025-04-04; accepted 2025-05-28; published in Volume 54, September 2025 |
| Keywords | Reverse fault; Model test; Soil-foundation interaction; Principal stress axis rotation; Embedded foundation |
| Author’s contribution | Fourth author; according to the CRediT statement of the paper, responsible for Software and Investigation |
1. Background and Research Questions
As transportation networks continue to grow in length and scale, an increasing number of extra-long and large transportation infrastructures are located near, span or cross active faults. Fault movement produces permanent ground deformation: in the 1999 Chi-Chi earthquake, the fault rupture passed through the Pi-feng Bridge and caused the collapse of three spans on its southern side. High-speed transportation projects commonly adopt foundations with embedment, such as pile foundations and caissons, yet the response of such foundations to fault movement remains unclear.
Previous centrifuge tests have investigated the influence of embedment depth (Ashtiani et al.) or foundation position (Loli et al.) on rupture propagation and foundation displacement. The paper identifies two shortcomings in this body of work:
- Structural load is generally neglected. In practice the structural load is considerable, and neglecting it may bias the assessment.
- Existing classifications rely on a known relative position between rupture and foundation. In engineering practice, the propagation path of the rupture through the overburden is difficult to predict accurately in advance, so methods that depend on this prior information have limited applicability in fault-resistant design.
To address these issues, the study conducts systematic tests with foundation position, embedment depth and load as variables, and uses displacement characteristics observable at the ground surface as the criterion for identifying interaction modes.
2. Test Method
2.1 Test Apparatus and Similitude Relations
Given the large number of test cases and the objective of identifying interaction modes rather than obtaining precise displacements, the study adopts 1g model tests (previous comparative studies have shown that the main rupture patterns in 1g and centrifuge tests are similar). The fault simulation apparatus was developed in-house (Figure 1); the model box measures 1600 mm × 300 mm × 800 mm (length × width × height) and can simulate normal and reverse fault movement at different dip angles.
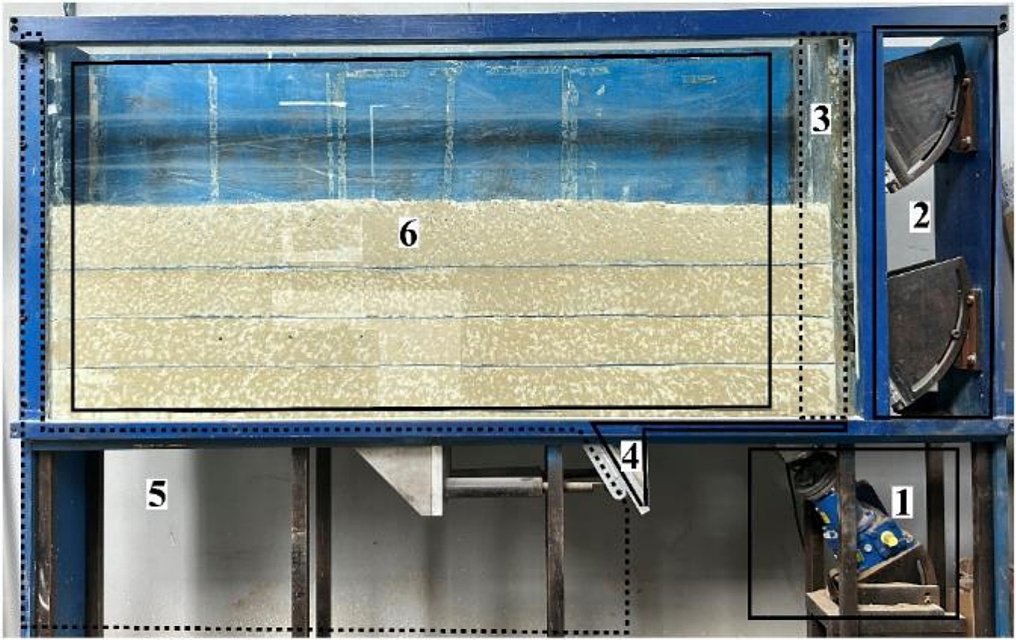
The main test parameters are as follows:
- Fault conditions: reverse fault with dip angle $\alpha = 60^\circ$ and a displacement rate of 0.5 mm/s; loading stops when the vertical offset reaches 120 mm.
- Model soil: Fujian standard sand with a relative density $D_r$ of 60% and a target dry unit weight of 15.7 kN/m³; peak friction angle 35.9°, residual friction angle 30.7°, dilation angle 7.39°.
- Similitude relations: sand is used to model a gravelly soil prototype, with a geometric similitude ratio $C_L = 1:23$, a unit weight similitude ratio $C_\gamma = 1:1.3$, an elastic modulus and stress similitude ratio $C_E = C_\sigma = 1:30$, and a strain similitude ratio $C_\varepsilon = 1:1$.
- Foundation model: an aluminium box simulates a rigid embedded foundation, with width $B = 100$ mm and a mass of about 5.05 kg; the load is applied by sand and weights placed inside the box.
- Instrumentation: a 6000 × 4000 pixel camera captures images at 1 s intervals, and particle image velocimetry (PIV) is used to analyse soil deformation; an LVDT measures the vertical displacement of the hanging wall with an accuracy of 0.01 mm.
2.2 Model and Test Programme
The model is illustrated in Figure 2: the overburden thickness is $H = 600$ mm; $D$ is the foundation embedment depth; $q$ is the foundation load; $\Delta h$ is the vertical bedrock offset; M is the free-field rupture outcrop point; $S$ is the horizontal distance from the hanging-wall-side edge of the foundation to point M, and $S/B$ characterises the foundation position.
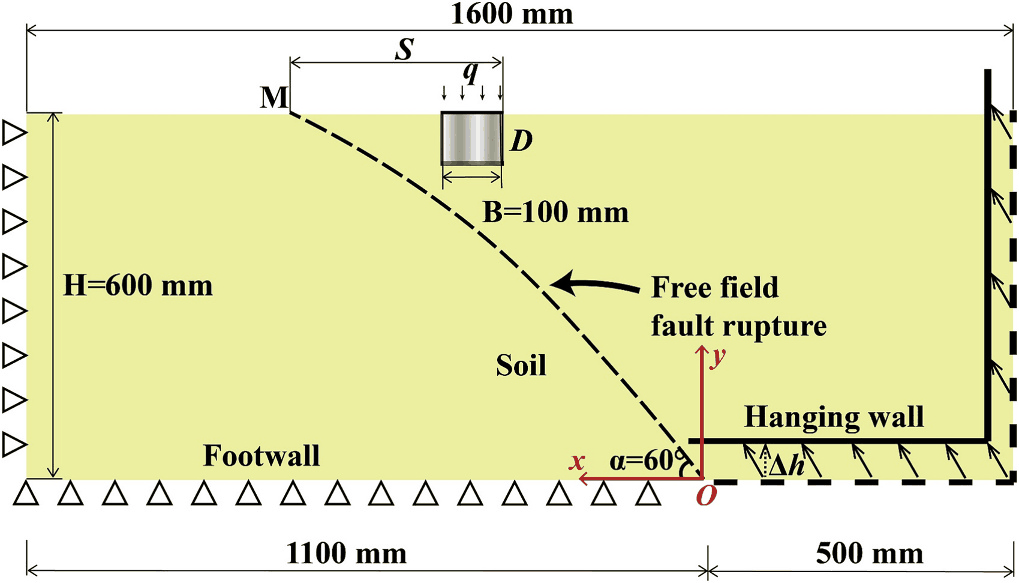
Cases are named according to the rule Case-depth (cm)-position (S/B)-load (kPa). Model loads of 2.55–11.05 kPa correspond, via the stress similitude ratio, to prototype loads of 77–330 kPa; embedment depths of 10, 20 and 40 cm correspond to foundation width-to-depth ratios of 1/1, 1/2 and 1/4, determined with reference to the Specifications for Design of Foundation of Highway Bridges and Culverts (JTG 3363—2019). All cases are listed below (Table 4 in the original paper):
| Embedment depth $D$ | $S/B$ | Load $q$ (kPa) | Test No. |
|---|---|---|---|
| — | — | Free field | Test 0 |
| 10 cm | 1 | 0, 4.25 | Test 1–2 |
| 10 cm | 2 | 0, 2.55, 3.35, 4.25 | Test 3–6 |
| 10 cm | 3 | 0, 2.55, 3.35, 4.25, 7.65, 11.05 | Test 7–12 |
| 20 cm | 1 / 2 | 0 | Test 13 / 14 |
| 20 cm | 3 | 0, 4.25 | Test 15–16 |
| 40 cm | 1 / 2 / 3 | 0 | Test 17 / 18 / 19 |
| 40 cm | 3.5 / 4 / 5 | 0, 4.25 | Test 20–25 |
2.3 Data Processing
The rupture zone is characterised by the PIV strain field: a pair of images is analysed for every 1 mm of offset, and the region where the strain reaches −0.1 is defined as the rupture zone. Vertical ground surface displacement is taken at 29 measurement points within the range from 750 mm to the left to 550 mm to the right of the fault point, fitted by cubic B-spline interpolation, and the displacement gradient is obtained from the fitted function. In the presence of a foundation, the surface displacement no longer follows the S-shaped distribution commonly observed in the free field; B-splines are therefore used for fitting instead of an S-shaped function.
3. Free-Field Test
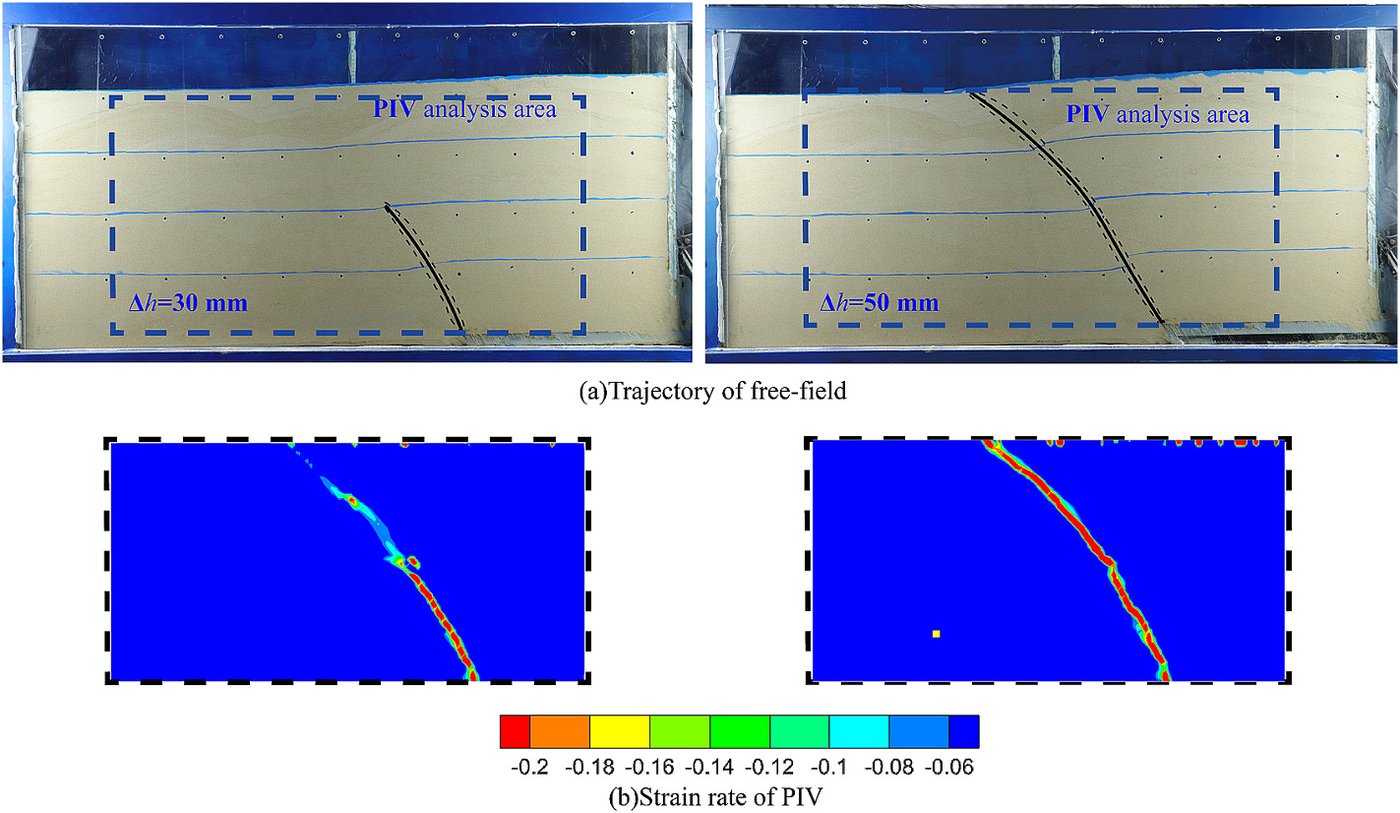
Under free-field conditions (Figure 3), the rupture propagates approximately along a straight line in the early stage of bedrock offset, then gradually bends toward the footwall as the offset increases and finally outcrops at the ground surface. The horizontal distance from the outcrop point to the bedrock offset point is 465 mm, i.e. 77% of the overburden thickness, close to the centrifuge results of Bransby et al. (80%) and Ashtiani et al. (82%). The rupture zone identified by PIV is consistent with visual observation, and all subsequent analyses represent the rupture zone by PIV strain contours.
4. Influence of Individual Factors
4.1 Foundation Position
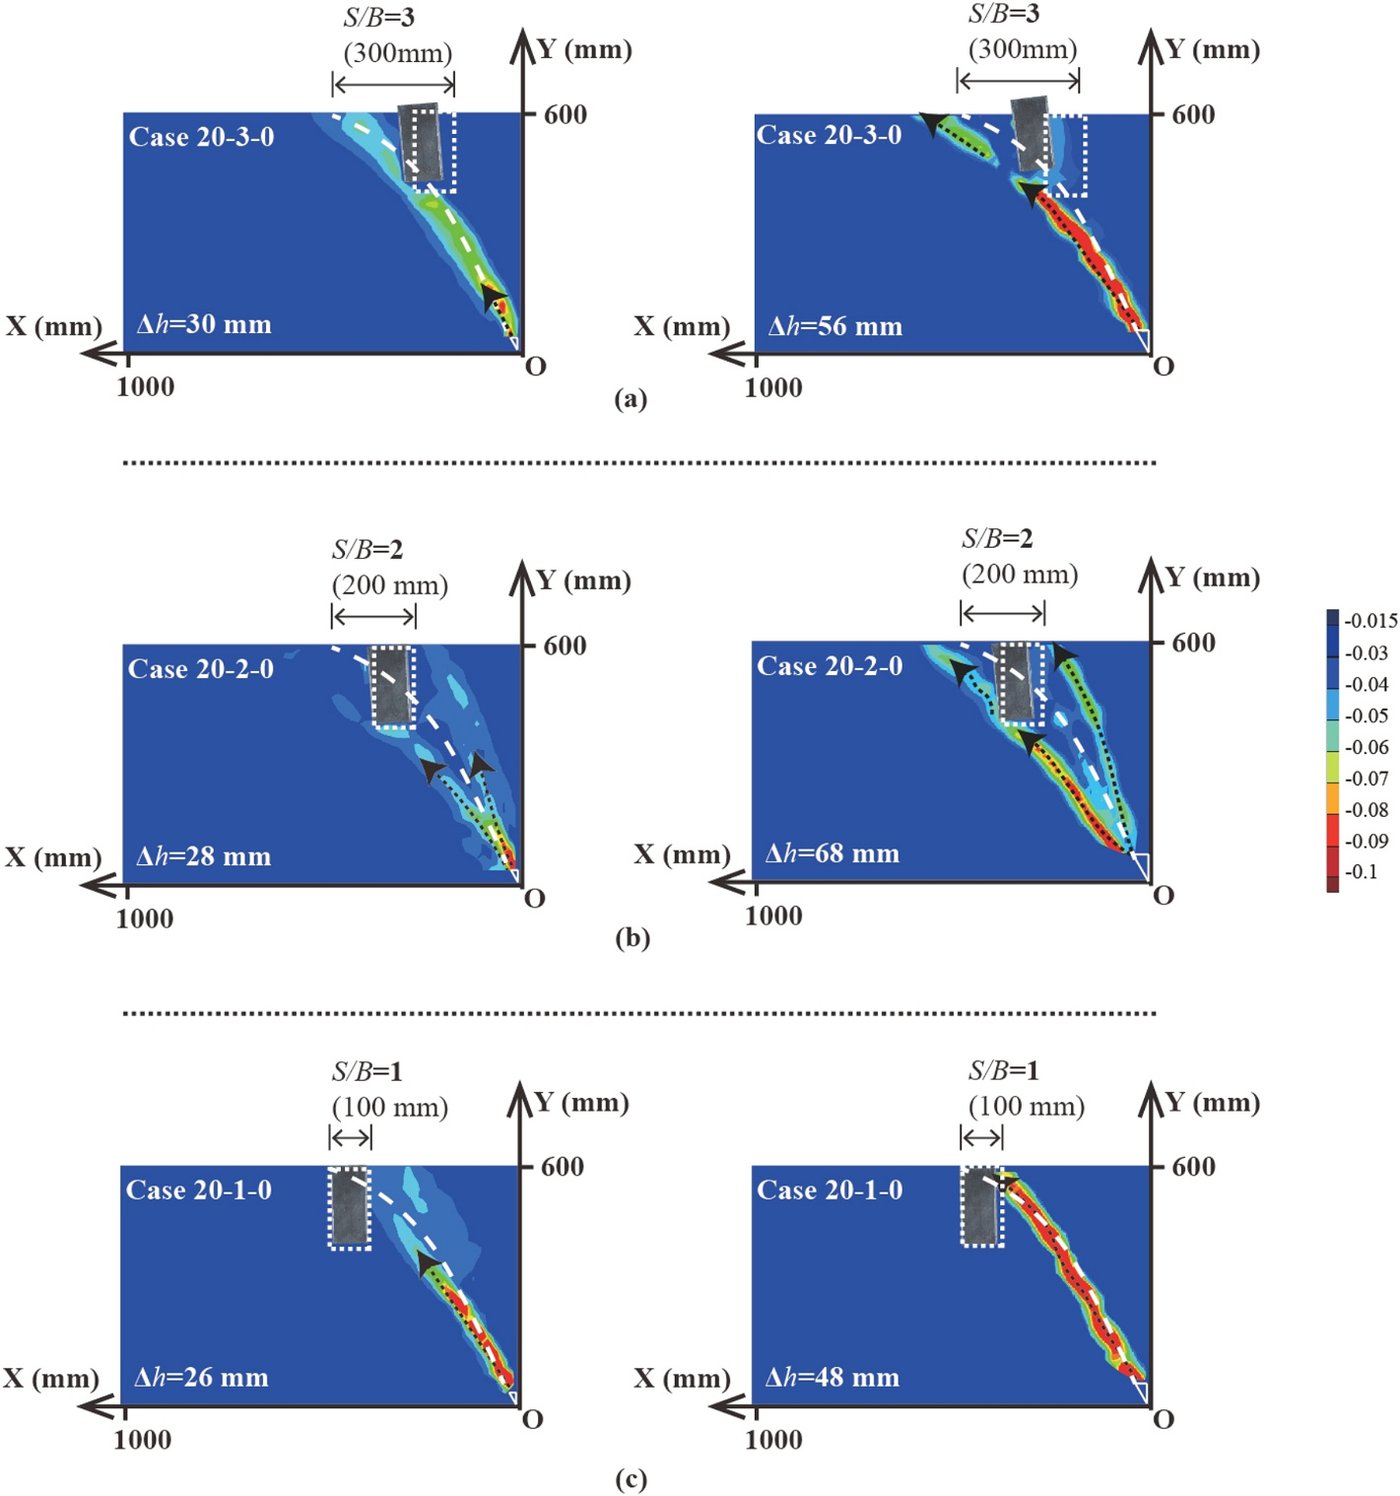
Figure 4 shows rupture propagation at different positions for an embedment depth of 20 cm without additional load (the white line indicates the free-field rupture path):
- $S/B = 3$: the foundation is far from the free-field outcrop point, the rupture acts directly on the foundation base, the foundation is uplifted, and a passive rupture zone forms on the footwall side;
- $S/B = 2$: the rupture is intercepted by the foundation, an additional rupture zone forms on the hanging-wall side, and a passive rupture zone still forms on the footwall side;
- $S/B = 1$: the foundation is close to the outcrop point, the rupture is completely blocked by the foundation on the hanging-wall side and outcrops along the foundation edge.
The closer the foundation is to the free-field rupture path, the more the rupture distribution shifts from the footwall side to the hanging-wall side, consistent with the centrifuge observations of Loli et al.; the farther the foundation lies toward the hanging wall, the larger the foundation displacement and rotation.
4.2 Foundation Embedment Depth
The influence of embedment depth depends on whether it changes the contact position between the rupture and the foundation. For $S/B = 1$, increasing the embedment depth has little effect on rupture propagation, and foundation displacement and rotation decrease with increasing depth. For $S/B = 3$, increasing the embedment depth has an effect similar to reducing $S/B$: the rupture shifts from the footwall side to the hanging-wall side and the vertical displacement of the foundation decreases continuously, but the rotation and horizontal displacement increase when the depth increases from 10 cm to 20 cm. The effects of the factors are thus mutually coupled, and the change in response cannot be determined from a single factor alone.
4.3 Foundation Load
The influence of load is examined for contact and non-contact situations:
- Contact situation ($S/B = 2$, $D = 10$ cm): as the load increases, the rupture shifts from the footwall side of the foundation to bifurcating around both sides of the foundation, and finally to the hanging-wall side.
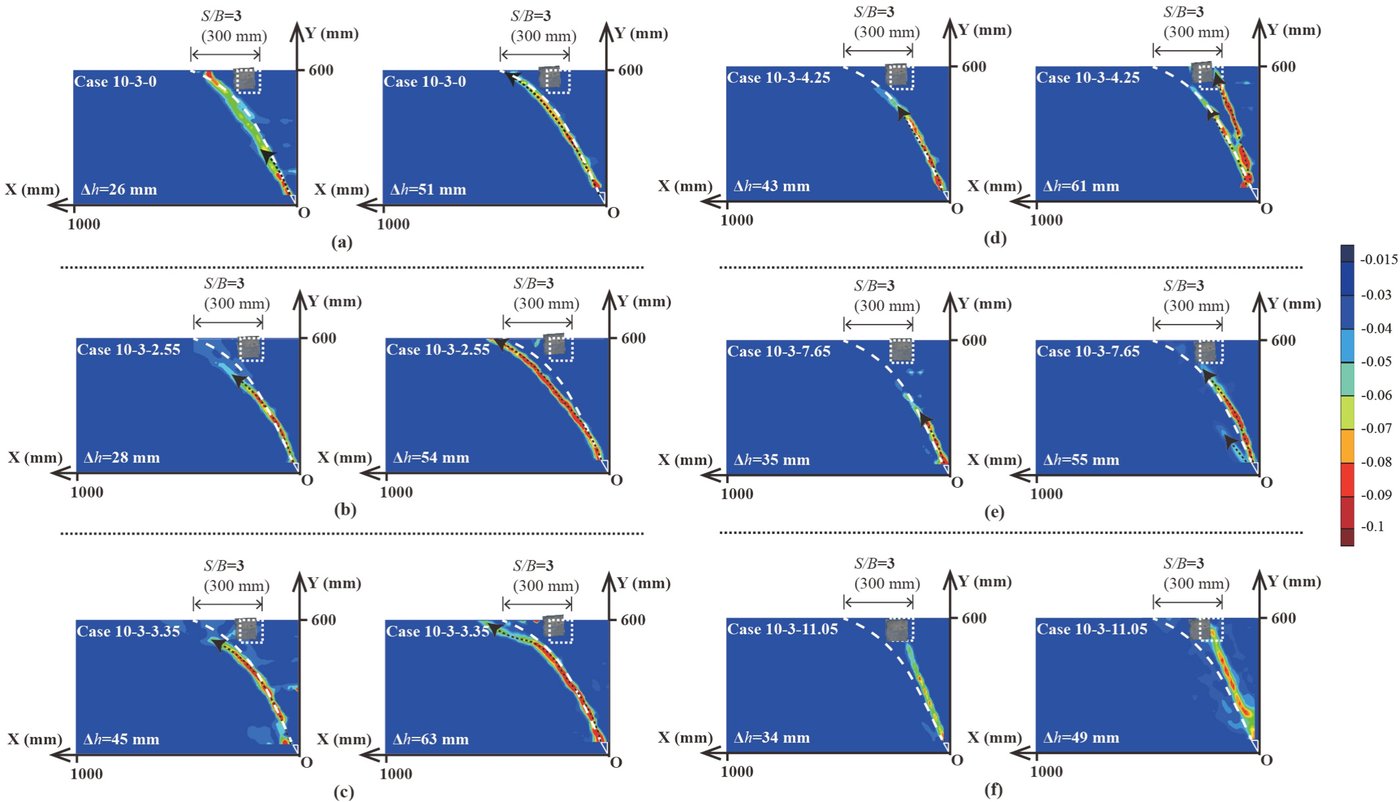
- Non-contact situation ($S/B = 3$, $D = 10$ cm, Figure 5): without load, the rupture passes beneath the foundation; at small loads (2.55 and 3.35 kPa), the rupture shifts toward the footwall side, away from the foundation, i.e. the load “repels” the rupture; as the load increases further (4.25–11.05 kPa), the rupture is “attracted” back to both sides of the foundation.
In both situations, the foundation rotation first increases and then decreases, with the maximum rotation occurring in the critical cases in which the rupture shifts from the footwall side to the hanging-wall side (Case 10-2-3.35 and Case 10-3-3.35). This result indicates that a foundation located outside the free-field rupture path is not necessarily safe: a large structural load can draw the rupture toward the foundation and produce significant rotation.
5. Three Interaction Modes
5.1 Classification Indices and Results
To compare all cases, the study selects five indices, each normalised by its maximum value: horizontal displacement, vertical displacement and rotation of the foundation, together with the difference $\Delta Y$ between the peak surface displacements on the hanging wall and footwall and the horizontal distance $\Delta X$ between the two peak points. Larger $\Delta X$ and $\Delta Y$ indicate surface uplift concentrated on one side; smaller values indicate a distribution closer to the uniform free-field pattern. On this basis, the 25 cases with foundations are divided into three modes: Bottom Contact, Sidewall-Bottom Contact and Sidewall Contact (Figure 6):
| Mode | Test No. | Surface displacement | Foundation displacement and rotation | Rupture distribution |
|---|---|---|---|---|
| Bottom contact | 7/8/9/15/24/25 | Wide and gentle uplift | Large horizontal and vertical displacement, predominantly translational | Secondary ruptures concentrated on the footwall side |
| Sidewall-bottom contact | 3/4/5/10/11/14/16/20/22 | Moderate extent of uplift | Significant rotation | Initial rupture contacts the foundation base; secondary ruptures appear on the footwall side |
| Sidewall contact | 1/2/6/12/13/17/18/19/21/23 | Rapid uplift on the hanging-wall side over a limited extent | Small displacement and rotation | Concentrated on the hanging-wall side of the foundation |
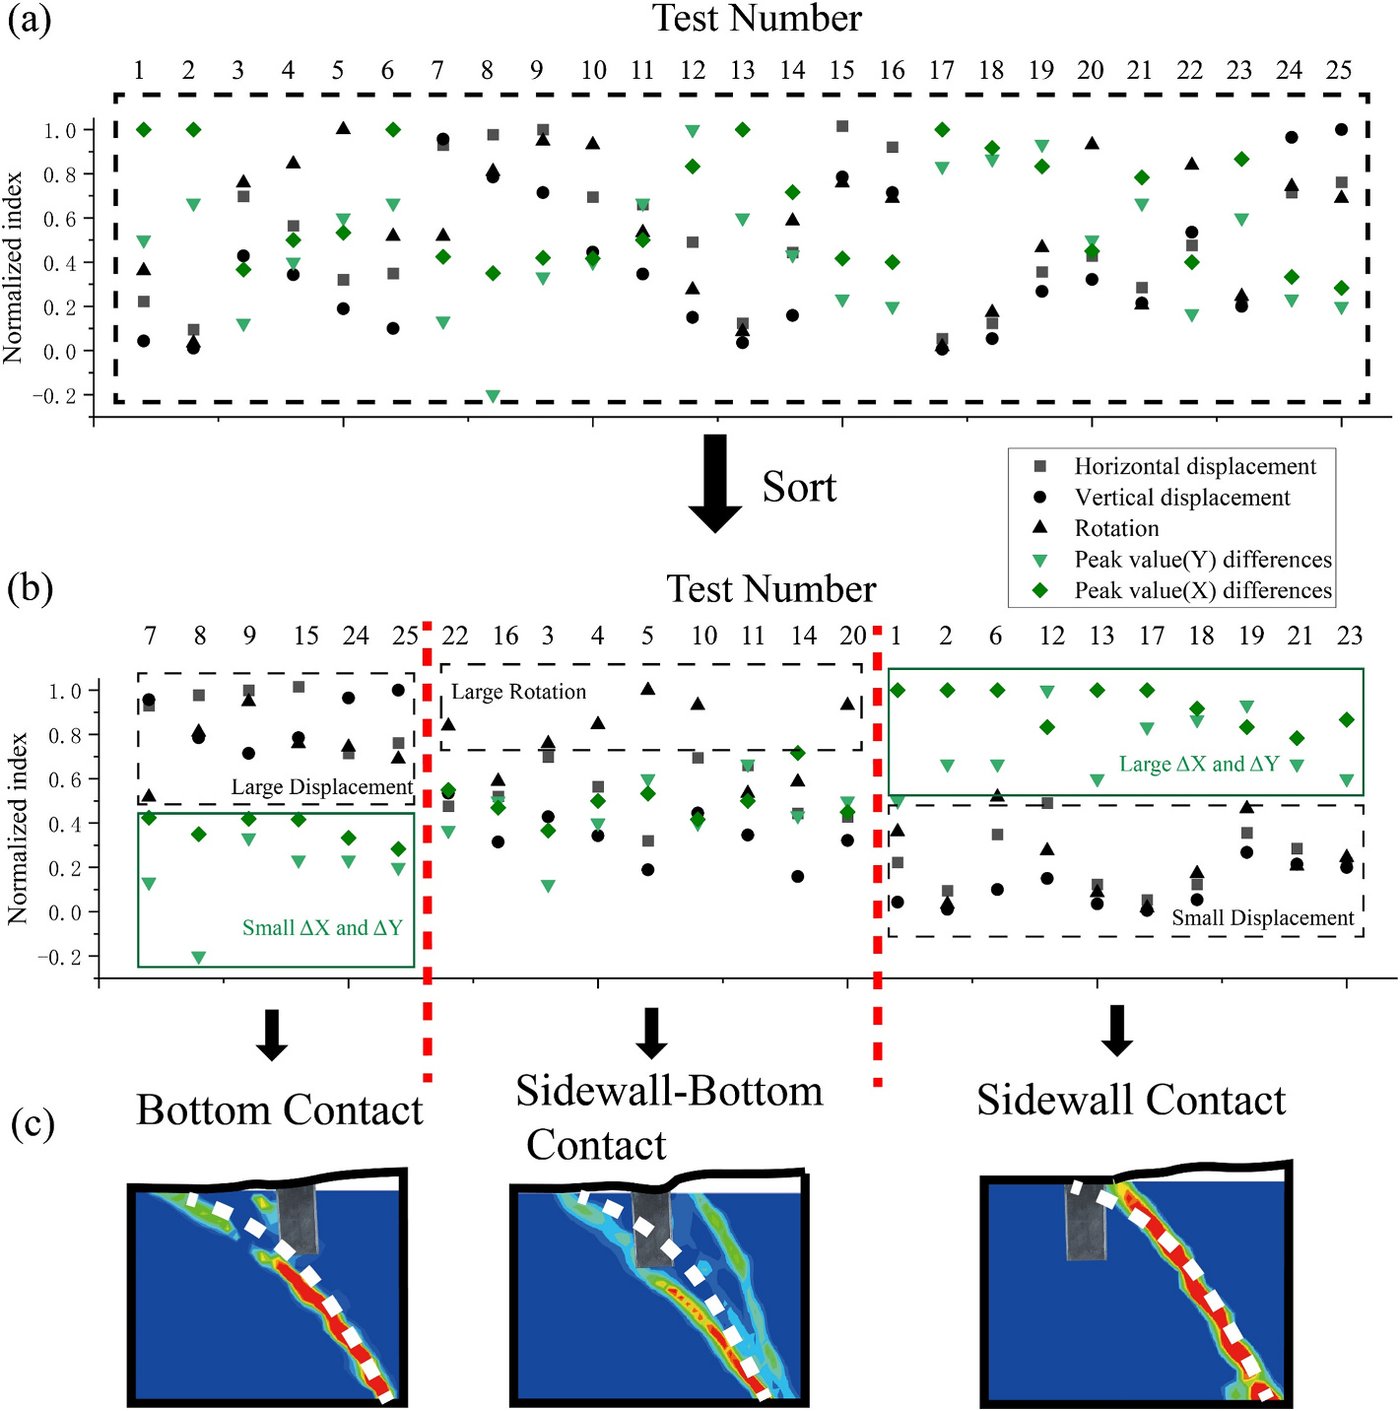
When the load is negligible, the three modes correspond one-to-one with the classification of Loli et al. based on subsurface rupture patterns. The classification method offers two improvements: it accounts for structural load, which is closer to engineering practice; and it uses surface and foundation displacement as criteria, which are easier to monitor than subsurface rupture paths, so that the mode can be identified through monitoring when the rupture path cannot be predicted.
5.2 Multi-Factor Coupling in Mode Transition
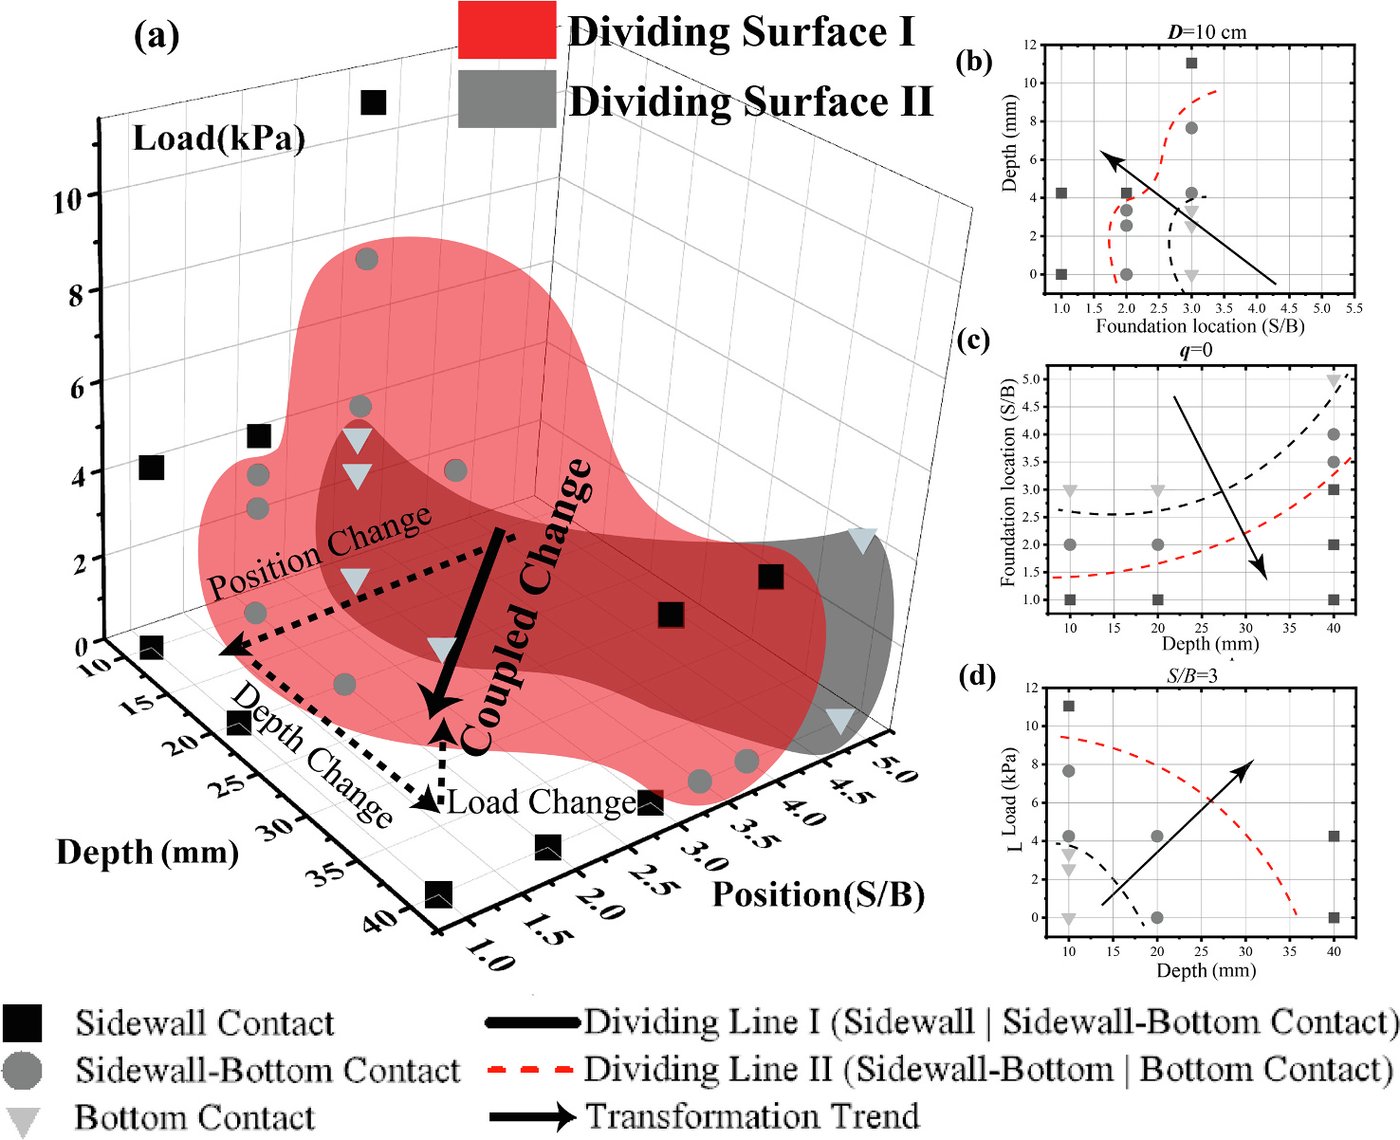
Figure 7 places the three modes in a three-dimensional parameter space with foundation position, embedment depth and load as axes; transition interfaces exist between the modes. A change along a single axis can trigger a mode transition, for example:
- Changing only the embedment depth: Case 40-2-0 → Case 10-2-0;
- Changing only the load: Case 10-3-0 → Case 10-3-11.05;
- Changing only the position: Case 10-3-0 → Case 10-2-0.
When the three factors vary simultaneously (e.g. Case 10-3-0 → Case 20-3-4.25), a mode transition occurs when the resultant direction crosses an interface. Within the range of tests completed, the study confirms one direction: with increasing load, increasing embedment depth and decreasing $S/B$, the interaction mode evolves along “bottom contact → sidewall-bottom contact → sidewall contact”. Owing to the limited number of tests, the exact location of the interfaces cannot yet be determined, but the result demonstrates the feasibility of studying mode transitions through combined factors.
5.3 Evolution of Rupture Patterns during Transition
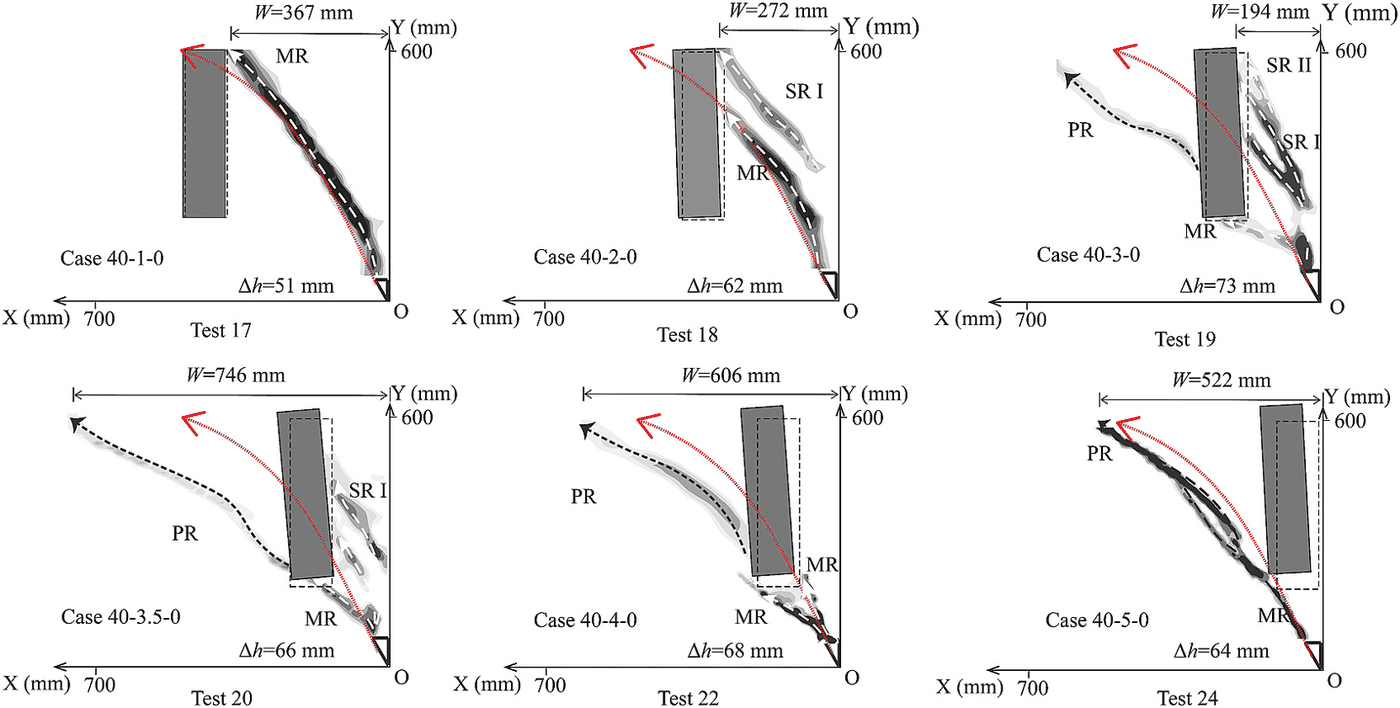
For an embedment depth of 40 cm without load, as the foundation position changes progressively from $S/B = 1$ to 5 (Test 17–24, Figure 8), the rupture pattern passes through the following stages:
- The rupture contacts the upper part of the foundation sidewall: the main rupture zone (MR) deflects and then outcrops;
- The contact point moves down to the middle of the sidewall: a secondary rupture zone (SR I) forms and outcrops;
- The contact point moves further down: MR contacts both the sidewall and the base, the number of upper secondary rupture zones first increases and then decreases, and a concave-upward passive rupture zone (PR) begins to form on the footwall side of the foundation;
- The rupture contacts the bottom corner of the foundation (Test 22): the upper secondary ruptures disappear, MR propagates upward along the foundation sidewall–soil interface, and PR changes to a concave-downward shape;
- The foundation moves further away (Test 24): the passive rupture zone on the footwall side gradually becomes the main rupture zone.
When the rupture contacts the upper half of the sidewall, the overall displacement and rotation of the foundation are small; they increase significantly when the rupture contacts the bottom corner and the base. The abrupt increase in rotation for Case 40-3.5-0 can be attributed to two factors: its sidewall contact point is closer to the bottom than that of Case 40-3-0, which weakens the sidewall restraint; and its bottom contact area is smaller than that of Case 40-4-0, which limits translation. Together these lead to increased rotation.
6. Interaction Mechanisms
6.1 Mechanism 1: Foundation Stiffness Alters the Rupture Path
When the rupture directly contacts the foundation, the rigid foundation alters the displacement pattern of the surrounding soil. After the rupture on the hanging-wall side is blocked by the foundation, it seeks a new outcrop along the path of minimum energy dissipation: a small change in path manifests as trajectory deflection, and a large change manifests as the generation of new secondary rupture zones. The closer the contact point is to the ground surface, the lower the energy required for deflected outcropping; the deeper the contact point, the greater the tendency to form one or more secondary ruptures. When the foundation approaches the bedrock offset point, the rupture direction becomes nearly parallel to the sidewall and turns into a shear band developing along the foundation–soil interface.
The shape of the passive rupture zone on the footwall side is related to the direction of foundation displacement. The closer the foundation is to the bedrock offset point, the closer the ratio of its vertical to horizontal displacement approaches the bedrock offset direction $\tan\alpha = 1.732$; the foundation motion changes from predominantly horizontal (similar to the translation of a retaining wall) to following the bedrock offset, and the passive rupture zone correspondingly changes from a concave-upward logarithmic spiral to a concave-downward logarithmic spiral.
6.2 Mechanism 2: Additional Stress Causes Rupture Deflection
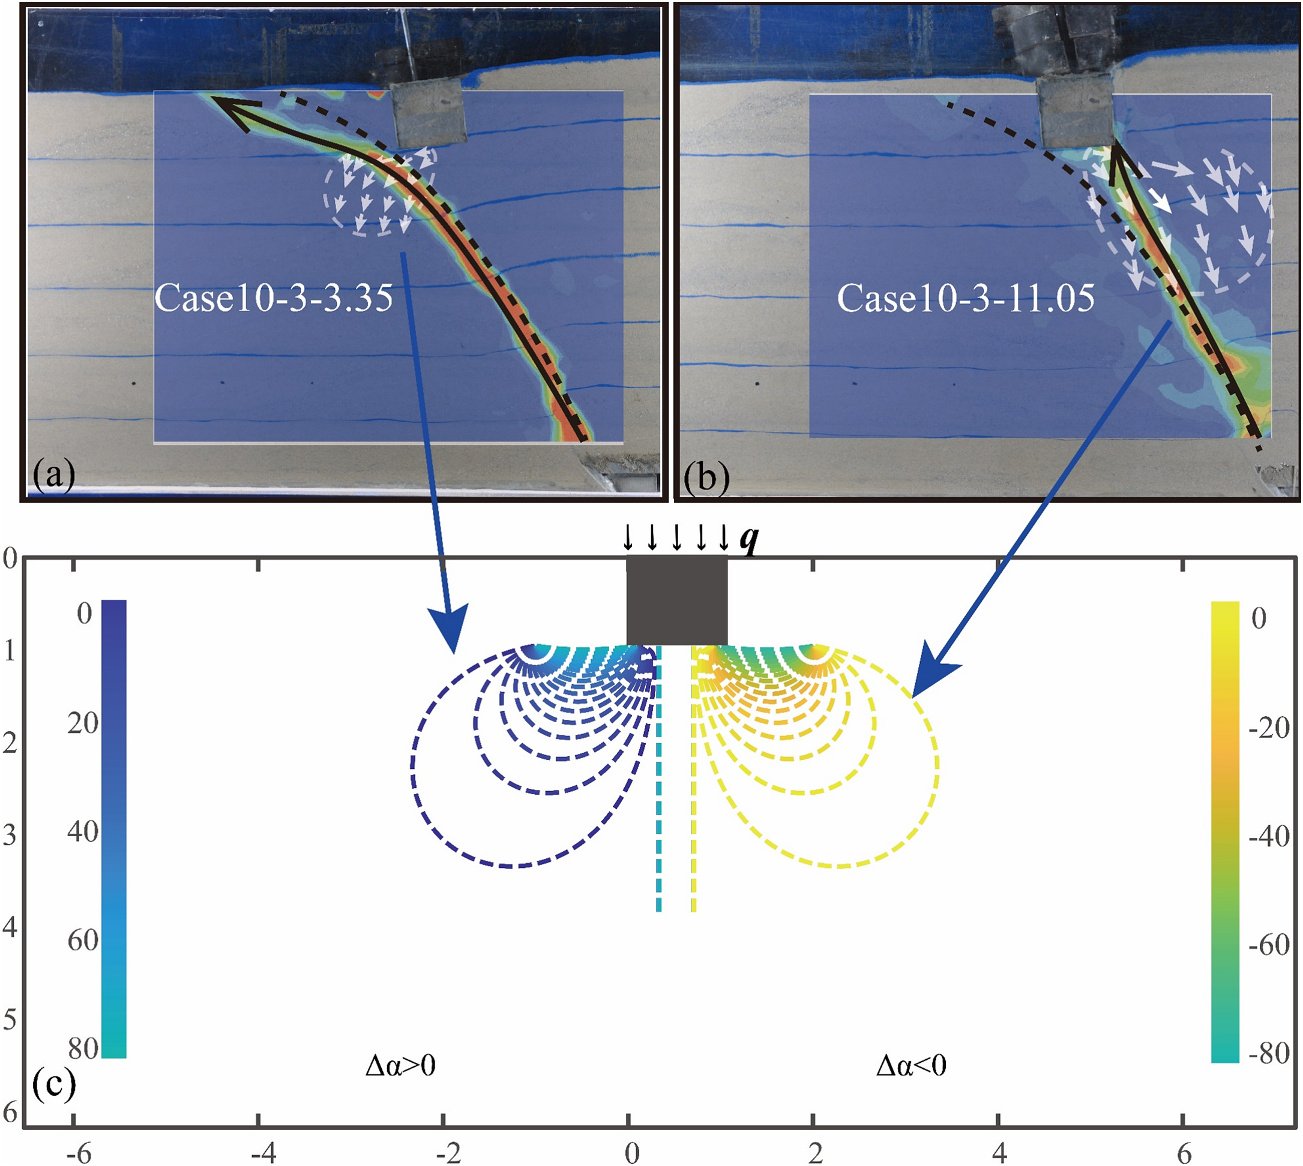
When the rupture passes beneath the foundation, the governing factors are the principal stress axis rotation and soil densification induced by the additional stress from the foundation. The study assumes that the free-field rupture already reflects the combined effects of the initial in-situ stress and the stress change caused by bedrock offset, that the three do not interact, and considers only the effect of the additional stress. The base pressure is approximated as a uniformly distributed load, and the additional stress coefficients $K_x$, $K_z$ and $K_{zx}$ are obtained from the Boussinesq solution:
$$ \sigma_x = K_x p + K_0 \gamma z, \qquad \sigma_z = K_z p + \gamma z, \qquad \tau_{zx} = K_{zx} p $$
The rotation angle of the principal stress axis and the stress ratio characterising the degree of densification are, respectively,
$$ \Delta\alpha = \frac{1}{2}\arctan\frac{2\tau_{zx}}{\sigma_x - \sigma_z}, \qquad K = \frac{\sigma_1 + \sigma_2}{K_0 \gamma z + \gamma z} $$
In the tests, the rupture beneath the foundation was observed to deflect toward the footwall side (Case 10-3-3.35) and toward the hanging-wall side (Case 10-3-11.05), with the deflection direction corresponding to the direction of principal stress axis rotation (Figure 9). The PIV results also reveal a densified zone beneath the foundation that resists deformation, i.e. an “elastic core”.
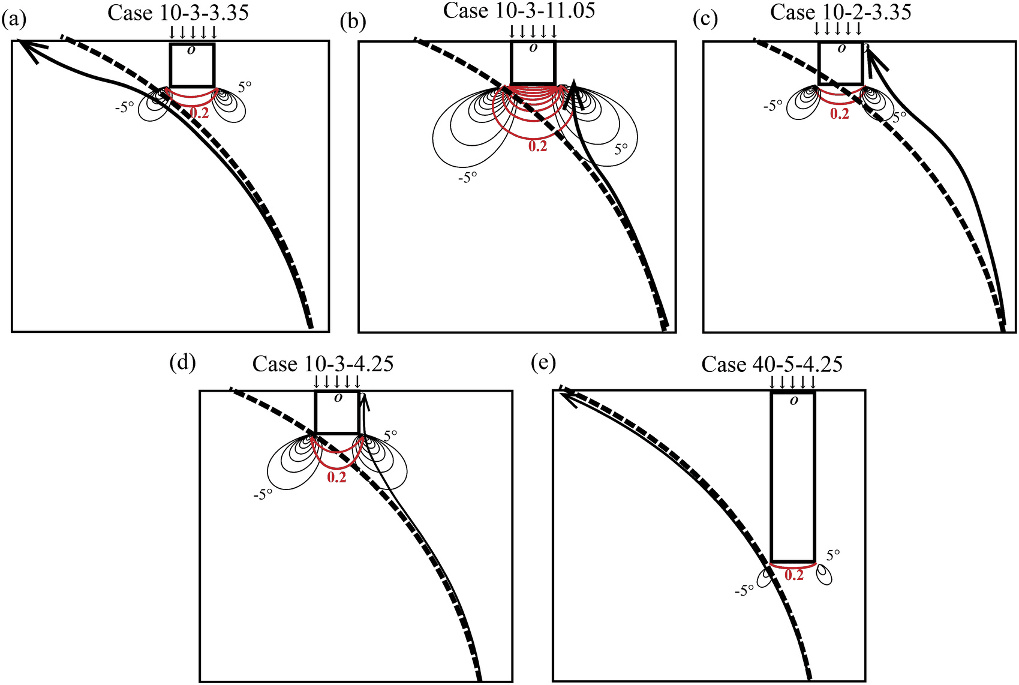
Defining the additional-stress influence zone by $\lvert\Delta\alpha\rvert > 5^\circ$ and $K > 0.2$ provides a unified explanation of the coupled effects of the three factors (Figure 10):
- Load determines the size of the influence zone: when the load increases from 3.35 kPa to 11.05 kPa, both the principal stress rotation zone and the densified zone expand significantly, their overlap with the rupture path changes, and the deflection direction changes from the footwall side to the hanging-wall side;
- Position determines the location of the influence zone relative to the rupture path;
- Embedment depth affects both the location and the size of the influence zone: for the same $q = 4.25$ kPa and the same relative position between the foundation base and the rupture, the influence zone of the foundation embedded at 40 cm is significantly smaller than that of the foundation embedded at 10 cm, and its effect on rupture propagation is small.
The greater the overlap between the free-field rupture path and the additional-stress influence zone, the more pronounced the rupture deflection caused by load changes.
7. Comparison with Field Cases and Design Recommendations
The study compares two typical failure forms with earthquake damage cases. When the action is applied mainly to the foundation base, the foundation moves together with the soil mass and undergoes large horizontal or vertical displacement (e.g. in the 1999 Kocaeli earthquake, the Arifiye overpass shifted laterally as a whole and four spans collapsed in succession). When the action is applied mainly to the sidewall, the soil exerts significant shear on the foundation (e.g. in the 1999 Chi-Chi earthquake, the Wu-Shi Bridge experienced about 2 m of reverse fault offset, and piers P1W and P2W were nearly sheared off). In field cases, the bottom contact mode generally corresponds to severe damage; the sidewall contact mode corresponds to minor damage in some cases, although cases of severe shear failure also exist; the sidewall-bottom contact mode, as a transitional mode, is difficult to identify in field cases.
Based on these results, the paper proposes the following design recommendations:
- Optimise foundation type and embedment depth: preferably adopt shallow embedment to avoid contact with the rupture; when contact is unavoidable, increase the embedment depth so that the interaction is confined to the upper part of the sidewall rather than the lower part of the sidewall or the base.
- Control structural load: reduce the structural self-weight when the rupture is expected to pass beneath the foundation; when contact is unavoidable, increase the self-weight appropriately to promote a transition to the safer sidewall contact mode.
- Adopt mode-specific measures: for bottom contact, an underlying soft layer can be installed to absorb the offset displacement; for sidewall contact, a fault-resistant wall layer can be installed; for bottom-corner contact, uplift piles can be used to reduce foundation rotation.
- Establish monitoring and emergency response systems: install displacement meters or inclinometers at critical locations, and, once an adverse interaction is identified, promptly implement measures such as traffic control, structural strengthening or evacuation.
8. Limitations
- Scale effects: in 1g tests the soil stiffness is lower than in the field, which may overestimate the shear resistance of the structure, particularly in the sidewall contact mode; the higher stress level in the field may lead to more concentrated shear bands. Previous comparative studies have also shown that 1g and centrifuge tests differ in rupture zone thickness, propagation rate and the formation of secondary ruptures.
- Rigid foundation assumption: the stiffness of the aluminium foundation is much greater than that of the surrounding soil, so the conclusions mainly represent high-stiffness, shallowly embedded foundations. When the foundation stiffness approaches that of the soil, deformation becomes more pronounced, and the sidewall contact and sidewall-bottom contact modes may also lead to shear failure; at lower stiffness, the rupture may shear through the foundation and continue propagating.
- Future work: centrifuge tests at elevated gravity are planned to compare rupture patterns under different failure mechanisms (in particular the formation of secondary rupture zones) and to examine whether structural damage under centrifuge conditions differs significantly from the 1g test results.
9. Main Conclusions
- An interaction classification framework is proposed based on ground surface displacement, foundation displacement and rupture propagation characteristics: when the rupture path is predictable, targeted fault-resistant design can be carried out accordingly; when it is not, the mode can be identified and addressed early through displacement monitoring.
- Transitions among the bottom contact, sidewall-bottom contact and sidewall contact modes are jointly determined by foundation position, embedment depth and structural load; different parameter combinations can produce similar evolution trends, and transition interfaces exist between the modes.
- Foundation load influences the rupture indirectly by altering the stress state of the soil: a moderate load can temporarily “push” the rupture away from the foundation, whereas an excessive load “attracts” the rupture to both sides of the foundation and increases the risk of rotation; the effect of load diminishes rapidly with increasing embedment depth.
- Foundation embedment depth and structural load should be optimised in conjunction with rupture path prediction, supplemented by displacement monitoring at critical locations and emergency response measures.
Citation
Guan L, Ling D, Hu C, Yu X, Song K. Experimental study on the interaction mechanisms of soil overlying embedded foundations under reverse faults. Transportation Geotechnics, 2025, 54: 101596. https://doi.org/10.1016/j.trgeo.2025.101596
@article{guan2025experimental,
  title   = {Experimental study on the interaction mechanisms of soil overlying embedded foundations under reverse faults},
  author  = {Guan, Li and Ling, Daosheng and Hu, Chengbao and Yu, Xiangyang and Song, Kunming},
  journal = {Transportation Geotechnics},
  volume  = {54},
  pages   = {101596},
  year    = {2025},
  doi     = {10.1016/j.trgeo.2025.101596}
}
Note: the figures and tables in this post are reproduced from the original paper (published by Elsevier); the captions are paraphrased and are provided for academic exchange only. Fig. 1, Fig. 23 and Fig. 26(a) of the original paper are adapted from third-party literature and are not reproduced here.